- Hadoop is an open source project of the Apache Foundation.
- It is a framework written in Java originally developed by Doug Cutting who named it after his son's toy elephant.
- Hadoop uses Google’s MapReduce and Google File System technologies as its foundation.It is optimized to handle massive quantities of data which could be structured, unstructured or semi-structured, using commodity hardware,that is, relatively inexpensive computers.
- Hadoop replicates its data across multiple computers, so that if one goes down, the data is processed on one of the replicated computers. It is a batch operation handling massive quantities of data, so the response time is not immediate.
- Hadoop is not good to process transactions due to its lack random access.
- Hadoop is not suitable for OnLine Transaction Processing workloads where data is randomly accessed on structured data like a relational database.
- Hadoop is not suitable for OnLine Analytical Processing or Decision Support System workloads where data is sequentially accessed on structured data like a relational database, to generate reports that provide business intelligence.
- It is NOT a replacement for a relational database system.
Sunday, December 7, 2014
Initials of HADOOP
Terminologies related to Hadoop
- Eclipse is a popular IDE donated by IBM to the open source community.
- Lucene is a text search engine library written in Java.
- Hbase is the Hadoop database.
- Hive provides data warehousing tools to extract, transform and load data, and then, query this data stored in Hadoop files.
- Pig is a high level language that generates MapReduce code to analyze large data sets.
- Jaql is a query language for JavaScript open notation.
- ZooKeeper is a centralized configuration service and naming registry for large distributed systems.
- Avro is a data serialization system.
- UIMA is the architecture for the development, discovery, composition and deployment for the analysis of unstructured data .
Monday, March 3, 2014
Buisness Intellegence
Buisness intellegence helps to manage data by different skills , technologies , security and quality risk . This also helps in acheiving better understanding of data .Buisness intellegence can also be considered as collective information. It helps in making predictions of buisness operations using gathered data in the warehouse.Buisness intellegence application also helps to tackle sales , financial, production ,etc buisness data . It helps in better decision making and can be also considered as a decision support system.
SAS buisness intellegence has analytical capabilities like ststistics, reporting, Data mining , prediction forcasting and optimization .They help in getting data in desired format . it heps in inproving data quality.
SAS buisness intellegence has analytical capabilities like ststistics, reporting, Data mining , prediction forcasting and optimization .They help in getting data in desired format . it heps in inproving data quality.
Friday, December 6, 2013
Sunday, December 1, 2013
Stats with R - 8 (Logistic Regression)
This week we are going to work on an example at the intersection of decision-making and global warming. The simulated dataset includes a dependent variable, change, for a list of 27 countries. Change indicates whether these countries are willing to take action now against global warming, or if they would rather wait and see (1 = act now, 0 = wait and see). Predictors include: median age (age), education index (educ), gross domestic product (gdp), and CO2 emissions (co2).
BL <- read.table("stats1-datafiles-Stats1.13.HW.10.txt",header= T)
Glimpse of the Dataset :-

1.What is the median population age for the countries which voted to take action against global warming? (round to 2 decimal places)
Ans:- 35.78
R- Output

2.Run a logistic regression including all predictor variables. Which predictors are significant in this model?
ANS :-The predictors educ and age are significant with a p value lower than .05
lrfit = glm(BL$change ~ BL$educ + BL$age + BL$gdp + BL$co2, family = binomial)
summary(lrfit)
R- Output

3. What does the negative value for the estimate of educ means?
4 .What is the confidence interval for educ, using profiled log-likelihood? (round to 2 decimal places, and give the lower bound first and the upper bound second, separated by a space)
Ans :- -31.17 -3.03
confint(lrfit)
R- Output
> confint(lrfit)
2.5 % 97.5 %
(Intercept) -7.120294915 7.62212837
BL$educ -31.171217249 -3.03349629
BL$age 0.151757331 0.73814438
BL$gdp -1.677996402 0.67880052
BL$co2 -0.001889047 0.00185111
5 . What is the confidence interval for age, using standard errors? (round to 2 decimal places, and give the lower bound first and the upper bound second, separated by a space)
Ans :- 0.09 0.65
R- Output
confint.default(lrfit)
2.5 % 97.5 %
(Intercept) -7.016319882 6.981360625
BL$educ -27.332984665 -0.119112070
BL$age 0.092877885 0.651260815
BL$gdp -0.986127869 0.835048069
BL$co2 -0.001910404 0.001148391
6. Compare the present model with a null model. What is the difference in deviance for the two models? (round to 2 decimal places)
Ans :- 16.30
R- Output
> with(lrfit, null.deviance - deviance)
[1] 16.30328
7. How many degrees of freedom are there for the difference between the two models?
Ans:- 4
R- Output
> with(lrfit, df.null - df.residual)
[1] 4
8.Is the p-value for the difference between the two models significant?
Ans:- Yes
R- Output
> with(lrfit, pchisq(null.deviance-deviance, df.null-df.residual, lower.tail = FALSE))
[1] 0.002638074 ---- this indicates that it is significant
9.Do chi-squared values differ significantly if you drop educ as a predictor in the model?
Ans :- Yes
R- Output
> wald.test(b = coef(lrfit), Sigma = vcov(lrfit), Terms = 2)
Wald test:
----------
Chi-squared test:
X2 = 3.9, df = 1, P(> X2) = 0.048
10. What is the percentage of cases that can be classified correctly based on our model?
Ans:- 81
R- Output
> ClassLog(lrfit, BL$change)
$rawtab
resp
0 1
FALSE 6 2
TRUE 3 16
$classtab
resp
0 1
FALSE 0.6666667 0.1111111
TRUE 0.3333333 0.8888889
$overall
[1] 0.8148148
Wednesday, November 27, 2013
Stats with R - 7
Source DataSet :- https://d396qusza40orc.cloudfront.net/stats1%2Fdatafiles%2FStats1.13.HW.07.txt
Run a regression model with salary as the outcome variable and years of experience as the predictor variable. What is the 95% confidence interval for the regression coefficient? Type your answer exactly as it appears in R but include only two decimal places (for example, if the 95% confidence interval is -1 to +1 then type -1.00 1.00)
Ans :- 27360.82 38259.76
Question Explanationmodel1 = lm(data$salary ~ data$years) AND confint(model1)
Run a regression model with salary as the outcome variable and courses as the predictor variable. What is the 95% confidence interval for the regression coefficient?
Ans:- 59656.54 65782.32
Question Explanationmodel2 = lm(data$salary ~ data$courses) AND confint(model2)
3 .Run a multiple regression model with both predictors and compare it with both the model from Question 1 and the model from Question 2. Is the model with both predictors significantly better than:
both single predictor models
the single predictor model based on years of experience
the single predictor model based on courses
none of the above
Question Explanationmodel3 = lm(data$salary ~ data$years + data$courses) AND anova(model1, model3) AND anova(model2, model3)
Run a standardized multiple regression model with both predictors. Do the confidence interval values differ from the corresponding unstandardized model?
Ans :- yes
model3.z = lm(scale(data$salary) ~ scale(data$years) + scale(data$courses)) AND confint(model3.z)
What function could you use to take a random subset of the data?
sample
Run the following command in R: set.seed(1). Now take a random subset of the original data so that N=15. Is the correlation coefficient between salary and years of experience in this sample higher or lower than in the whole data set?
Ans :- Lower
Wednesday, November 13, 2013
Stats with R - 6
data<- read.table("Stats1.13.HW.04.txt",header = T)
In a model predicting salary, what is the unstandardized regression coefficient for years, assuming years is the only predictor variable in the model?
5638
data <-read.table("week6.txt",header = T)summary(model1 <- lm((data$salary) ~ (data$years)))
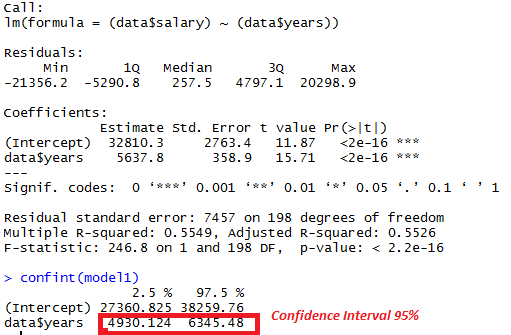
In a model predicting salary, what is the 95% confidence interval for the unstandardized regression coefficient for years, assuming years is the only predictor variable in the model?
4930 6345
data <-read.table("week6.txt",header = T)
summary(model1 <- lm((data$salary) ~ (data$years)))
confint(model1)
In a model predicting salary, what is the unstandardized regression coefficient for years, assuming years and courses are both included as predictor variables in the model?
4807
summary(model2 <- lm((data$salary) ~ (data$years)+(data$courses)))
In a model predicting salary, what is the 95% confidence interval for the unstandardized regression coefficient for years, assuming years and courses are both included as predictor variables in the model?
4140 5473
summary(model2 <- lm((data$salary) ~ (data$years)+(data$courses)))
confint(model2)
What is the predicted difference in salary between Doctors and Lawyers assuming an equal and average number of years and courses?
9204
Subscribe to:
Posts (Atom)