Source DataSet :- https://d396qusza40orc.cloudfront.net/stats1%2Fdatafiles%2FStats1.13.HW.07.txt
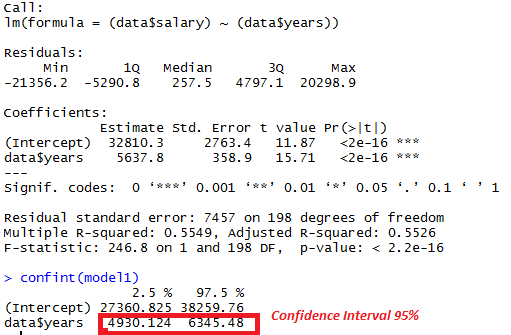
Run a regression model with salary as the outcome variable and years of experience as the predictor variable. What is the 95% confidence interval for the regression coefficient? Type your answer exactly as it appears in R but include only two decimal places (for example, if the 95% confidence interval is -1 to +1 then type -1.00 1.00)
Ans :- 27360.82 38259.76
Question Explanationmodel1 = lm(data$salary ~ data$years) AND confint(model1)
Run a regression model with salary as the outcome variable and courses as the predictor variable. What is the 95% confidence interval for the regression coefficient?
Ans:- 59656.54 65782.32
Question Explanationmodel2 = lm(data$salary ~ data$courses) AND confint(model2)
3 .Run a multiple regression model with both predictors and compare it with both the model from Question 1 and the model from Question 2. Is the model with both predictors significantly better than:
both single predictor models
the single predictor model based on years of experience
the single predictor model based on courses
none of the above
Question Explanationmodel3 = lm(data$salary ~ data$years + data$courses) AND anova(model1, model3) AND anova(model2, model3)
Run a standardized multiple regression model with both predictors. Do the confidence interval values differ from the corresponding unstandardized model?
Ans :- yes
model3.z = lm(scale(data$salary) ~ scale(data$years) + scale(data$courses)) AND confint(model3.z)
What function could you use to take a random subset of the data?
sample
Run the following command in R: set.seed(1). Now take a random subset of the original data so that N=15. Is the correlation coefficient between salary and years of experience in this sample higher or lower than in the whole data set?
Ans :- Lower
