Source DataSet :- https://spark-public.s3.amazonaws.com/stats1/datafiles/Stats1.13.HW.02.txt
Initially I read the text file in form of a dataframe in R by running the following command ,I named the dataframe as "impact" :-
> impact <- read.table("Stats1.13.HW.02.txt",header = T)

A data set with 96 obsetvations and 4 varibles is created in R
1.How many rows of data are in the data file?
96
Make sure you read the data with the argument: header=TRUE Then: nrow(data) OR dim(data)
2.What is the name of the dependent variable?
command : names(data)
Ans : SR
3.What is the mean of SR across all subjects?
command : mean(data$SR) OR describe(data)
> mean(impact$SR)
[1] 12.65625
4.What is the variance of SR across all subjects?
Command : var(data$SR
output :
> var(impact$SR)
[1] 6.54375
5.What is the mean of SR for all subjects at pretest?
command :- pre = subset(data, data$time=="pre") THEN mean(pre$SR)
Output :
> pre<- subset(impact,impact[ ,3]== "pre")
> mean(pre$SR)
[1] 12.02083
6.What is the standard deviation of SR for all subjects at posttest?
command :- post = subset(data, data$time=="post") THEN sd(post$SR)
Output :
> sd(post$SR)
[1] 2.449128
7.What is the median of SR for all subjects at posttest?
describe(post$SR) AND median(post$SR)
Output:-
> describe(post$SR)
var n mean sd median trimmed mad min max range skew kurtosis se
1 1 48 13.29 2.45 13.5 13.28 2.22 9 19 10 0.06 -0.49 0.35
> median(post$SR)
[1] 13.5
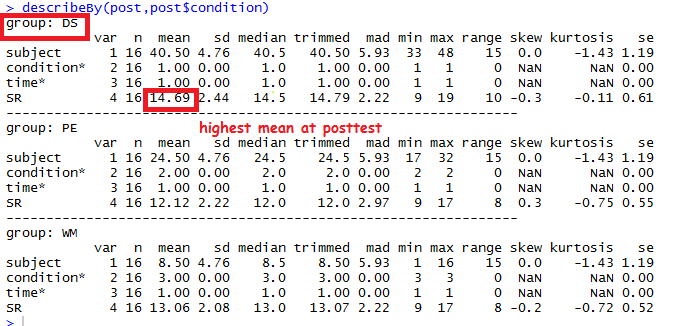
8.Which group has the highest mean at posttest?
Ans :- DS
.Command :- describeBy(post, post$condition)
Output :-
9.Which one best approximates a normal distribution?
Option :-
| WM group at pretest | |||
| WM group at postest Ans :- WM group at postest | |||
| PE group at pretest | |||
| PE group at posttest | |||
| DS group at pretest | |||
| DS group at postest |
post.wm = subset(post, post$condition=="WM")
pre.pe = subset(pre, pre$condition=="PE")
post.pe = subset(post, post$condition=="PE")
pre.ds = subset(pre, pre$condition=="DS")
post.ds = subset(post, post$condition=="DS")
par(mfrow= c(2,3))
hist(pre.wm[,4])
hist(post.wm[,4])
hist(pre.pe[,4])
hist(post.pe[,4])
hist(pre.ds[,4])
hist(post.ds[,4])

10.Which group showed the biggest gains in SR?
Code :-
pre.wm = subset(pre, pre$condition=="WM")
post.wm = subset(post, post$condition=="WM")
pre.pe = subset(pre, pre$condition=="PE")
post.pe = subset(post, post$condition=="PE")
pre.ds = subset(pre, pre$condition=="DS")
post.ds = subset(post, post$condition=="DS")
> mean(post.wm$SR)-mean(pre.wm$SR)
[1] 1.3125
> mean(post.pe$SR)-mean(pre.pe$SR)
[1] 0.0625
> mean(post.ds$SR)-mean(pre.ds$SR)
[1] 2.4375
ANS :- DS
5 Answers are incorrect , questions: 2, 4 ,5,6, 7
ReplyDeleteHey !! .All answers should be rounded to 2 significant digits. I explained the procedure to solve the question in R but One should pay attention to the format in which the answers are required .
DeleteAll the answers in the blog are absolutely correct !!! All answers should be rounded to 2 significant digits if asked to do so .
ReplyDeleteSASLearner you Rock Dude. Thanks for your help again!!
ReplyDeleteExcellent!! Initially some answers went wrong but up to two decimal rounded off it was correct
ReplyDeleteSASLearner you're awesome !! Thanks :D
ReplyDeleteThanks for helping
ReplyDeleteR u in Chicago area
ReplyDelete